
Redefine Logic
Redefine Logic Media
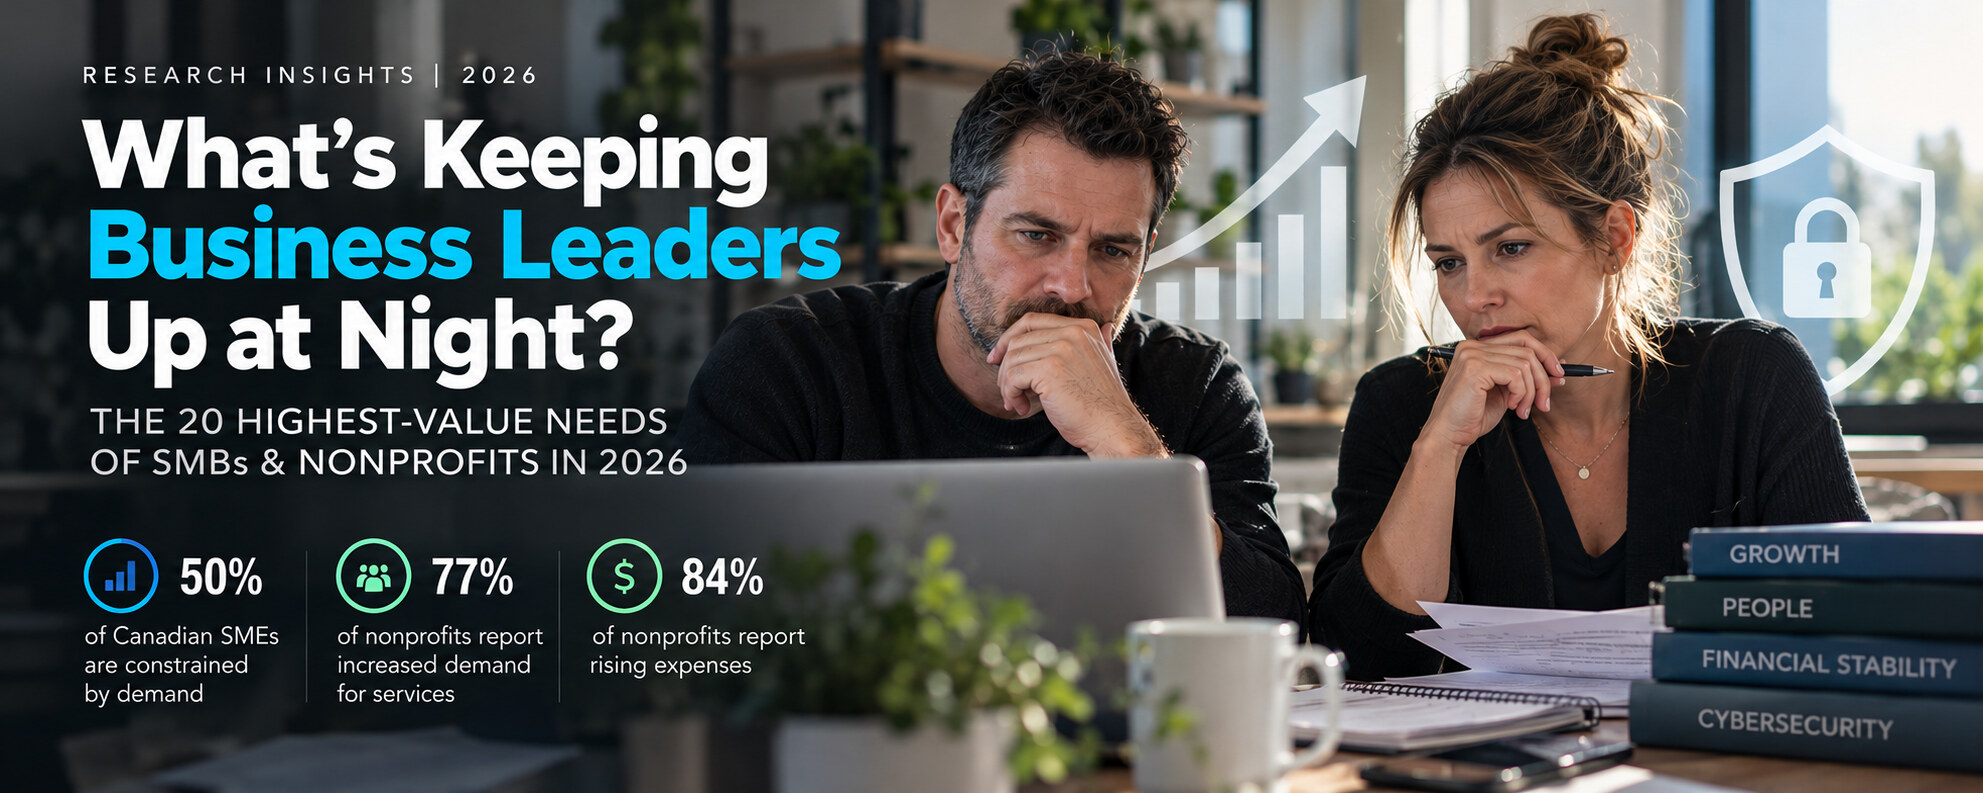
What’s keeping business leaders up at night? The 20 highest-value needs of small businesses and nonprofits in 2026. 50 per cent of Canadian SMEs are constrained by demand, 77 per cent of Ontario nonprofits report increased demand for services, and 84 per cent report rising expenses.
28 October 2026 Nine-minute read Three sources, every figure checked against the original Nonprofit figures are Ontario-wide, from the Ontario Nonprofit Network
RE.SIGNAL · Research insights · 2026

What’s keeping business leaders up at night?

The 20 highest-value needs of small businesses and nonprofits in 2026

Revenue uncertainty, rising costs, workforce shortages and cyber threats arrive at once. We read the current Canadian economic and nonprofit research to work out what matters most when an organization is asked to do more with less.

50%

of Canadian SMEs name insufficient demand as their top constraint on expansion

CFIB, October 2026
77%

of Ontario nonprofits report an increase in demand for their services

ONN, October 2026
84%

of the same nonprofits report their expenses increasing

ONN, October 2026
28 October 2026 Nine-minute read Three sources, every figure checked against the original

Small businesses and nonprofits are being asked to do several things at once: grow revenue, hold costs down, keep good people, adopt new technology, and protect what they have already built.

Each of those is reasonable on its own. Together they exceed what most organizations of this size can resource. So the question worth answering is not what an organization could do, but which of those needs deserves attention first.

We read the current Canadian economic and nonprofit sector research, together with the 2026 Verizon breach report, and ranked 20 organizational needs by how much is lost when each one goes unaddressed.

One finding shaped everything that follows. Organizations are not asking for more technology, more marketing or more services. They are asking for stability, for growth they can rely on, and for some confidence about next year.

Growth is harder. Stability is worth more.

The Canadian Federation of Independent Business publishes a monthly read on small business confidence. The October 2026 edition puts long-term optimism at 50.0, the exact point where owners expecting a stronger year and owners expecting a weaker one cancel out.

Canadian small and medium business — October 2026

CFIB Monthly Business Barometer, published 22 October 2026. 301 responses, accurate to ±5.6 per cent, 19 times in 20.

  • 50%name insufficient demand as the top constraint on expansion
  • 43%name a shortage of skilled labour as the next
  • 22%plan to lay staff off, against 11% planning to hire — the weakest net staffing intentions since the pandemic
  • 21%is the share of higher fuel costs businesses expect to pass on to customers. The rest is absorbed

The fuel figure deserves a second look. Costs are rising and roughly four fifths of the increase is carried rather than passed along. Margin is where the pressure lands.

The nonprofit picture shows the same pressure from a different direction.

Ontario nonprofits — October 2026

Ontario Nonprofit Network, Ontario’s nonprofits: Focused on preparedness during uncertainty, published 15 October 2026. 741 organizations responded.

  • 77%report increased demand for their services
  • 84%report increased expenses, while only 44% report revenue increases
  • 53%report staff recruitment and retention difficulties
  • 31%have no access to a reserve fund at all, and a further 34% have already drawn on theirs

Demand is up. Revenue is flat. Expenses are climbing. A third of the sector has no reserve to absorb the difference.

Two very different sectors share one problem: the distance between what an organization is expected to deliver and what it has available to deliver it with.

The ranking

The 20 highest-value needs in 2026

Ranked by economic impact, urgency, prevalence, and what it costs an organization to leave the need unaddressed.

How to read this. The ranking is our own editorial synthesis, informed by the sources listed at the end. No survey asked organizations to rank these exact 20 needs against each other, and the priority ratings are qualitative judgements rather than statistical findings. Priority will move with size, sector, geography and financial position.

Extreme — critical to viability Very high — major impact High — significant Moderate — less urgent
Rank
Organizational need
SMB
Nonprofit
01
Reliable revenue and funding generation
Extreme
Extreme
02
Cash-flow and liquidity stability
Extreme
Extreme
03
Cost control and margin preservation
Extreme
Extreme
04
Finding and retaining capable people
Extreme
Extreme
05
Customer, donor and member retention
Very high
Extreme
06
Operational productivity and efficiency
Very high
Very high
07
Financial planning and forecasting
Very high
Very high
08
Cybersecurity, data protection and resilienceCovered in detail below
Very high
Very high
09
Revenue and funding diversification
High
Extreme
10
Leadership and management capacity
Very high
Very high
11
Technology and AI-driven productivity
Very high
High
12
Access to capital and flexible funding
Very high
Very high
13
Integrated systems and data infrastructure
High
High
14
Regulatory, tax, privacy and compliance capability
Very high
High
15
Performance, outcome and impact measurement
High
Very high
16
Capacity to meet increasing demand
High
Extreme
17
Workforce skills development and reskilling
Very high
High
18
Governance and board effectiveness
Moderate
Very high
19
Supplier and business-continuity resilience
High
High
20
Trust, reputation and stakeholder confidence
Very high
Very high

The first seven are money and people. Nothing on this list displaces them, and we would not argue otherwise.

Two of the twenty decide the others

All twenty matter. Two of them shape what happens to the rest, because one creates the opportunity and the other decides whether an organization keeps it.

Growth: the problem is reliability, not attention

The top-ranked need is not more attention. It is a dependable way to generate revenue, secure funding, and hold on to relationships with the people an organization already serves.

For a small business that means qualified customers, repeat work, and less exposure to an unpredictable sales cycle. For a nonprofit it means donor relationships that survive a difficult year, funding from more than one place, and a community that knows the organization exists.

The CFIB figure puts a number on the first half of that. Half of Canadian SMEs name insufficient demand as the single thing holding expansion back — ahead of labour, ahead of capital, ahead of cost. Visibility is the constraint, and it is the constraint for more owners than any other.

Growth without financial stability is fragile. Visibility without a path from interest to revenue is decoration.

Protection: eighth on the list, and capable of erasing the other nineteen

Cybersecurity ranks eighth rather than first, and we are not going to inflate it. Financial and workforce pressure is felt every day. A serious incident is not.

The asymmetry is in the consequence. Verizon’s 2026 Data Breach Investigations Report finds the most frequent causes of a breach continue to involve the human element — social engineering, phishing and stolen credentials — alongside the exploitation of software vulnerabilities. None of those require a sophisticated adversary, and none of them care how small the organization is.

For an organization of this size the damage rarely stays technical:

  • Operations stop while systems are recovered, and the work does not pause to wait.
  • Client, donor or member information is exposed, which carries notification duties under PIPEDA and, for health information, under PHIPA.
  • Money leaves, through fraud or through the cost of recovery.
  • Contracts and funders ask difficult questions afterwards.
  • Confidence goes, and confidence is slower to rebuild than any system.

Lost confidence is why protection sits beside growth rather than in an IT budget. An organization spends years earning trust from customers, donors and funders. A single incident puts the whole of it in question at once.

Growth creates the opportunity. Protection decides whether the organization keeps it.

An organization can market well and lose it all in a bad fortnight. An organization can be well defended and still close, because the revenue was never there. Neither half is sufficient on its own, and that is the argument for treating growth and protection as one job.

Where we come in

Grow & Protect™, and the honest size of it

Four of the twenty are ours to execute, and five more we contribute to. We would rather name which, than imply we cover the list.

Grow

Build visibility that produces something

Improving how an organization is found, strengthening the relationships it already has, and building a measurable path from interest to revenue or funding.

The objective is not more traffic. It is fewer dead-end enquiries, and a clearer line between what the organization wants and what it gets.

Protect

Reduce the exposure growth creates

Finding where an organization is reachable, closing the gaps that are cheap to close, and making security decisions small enough to take.

The objective is not the elimination of risk. No one can offer that. It is less avoidable exposure, and a plan for the morning something goes wrong.

What we take off your plate, and what we do not

Against the twenty needs above, here is the honest split. We are not a solution to this list. We execute on a defined part of it so the capacity you have goes to the rest.

We executeFour of the twenty
  • 01Reliable revenue and funding generation
  • 08Cybersecurity, data protection and resilience
  • 05Customer, donor and member retention
  • 20Trust, reputation and stakeholder confidence
We contributeFive more, in part
  • 09Funding diversification
  • 11Technology and AI productivity
  • 13Systems and data infrastructure
  • 14Privacy and compliance capability
  • 19Business-continuity resilience
Not usThe other eleven
  • 02Cash flow
  • 03Cost control
  • 04Hiring and retention
  • 06Operational productivity
  • 07Financial forecasting
  • 10Leadership capacity
  • 12Access to capital
  • 15Impact measurement
  • 16Service capacity
  • 17Reskilling
  • 18Board governance

Those eleven need an accountant, a board, a recruiter or your own judgement, and we will say so rather than quote for them. Where we know someone good, we will make the introduction and step back. The value of taking four things off a list of twenty is that the remaining sixteen get the attention they were never going to get otherwise.

A starting point

Ten questions, and a view of where you stand

For an organization unsure which of the twenty applies to it, our Grow & Protect Assessment is free and takes about four minutes.

  • Five questions on how you grow, five on how well that growth holds up.
  • You get the result immediately, with the gap between growth and protection named.
  • It asks for a business name and an email address, because we send you the result. It asks for nothing else.

The assessment is a structured opinion built from your own answers, which we do not verify. Our methodology and limitations statement sets out exactly what it is and is not.

Run the free assessment →

There is no obligation and no sequence of follow-up emails, and you keep the result either way.

The best investment is the one that solves a real problem

The 2026 economy makes one thing clearer than it was: an organization does not succeed by adopting more tools, platforms or initiatives. It succeeds by addressing the handful of things that decide its year.

For one organization that will be cash flow. For another it will be holding on to three people it cannot replace. For another it will be a funder asking a question about data the organization cannot answer.

There is no universal solution, and anyone offering one is describing a product rather than your situation.

There is, however, a universal starting point. Work out what matters most. Measure where you currently stand. Then put the effort where it creates something lasting.

We will take four of the twenty, and we will be straight with you about the rest.

Grow with purpose. Protect what matters.

Sources & further reading

Where the figures come from

Every percentage in this piece was read off the source rather than quoted from a summary. The ranking itself is ours and is not a finding of any of these studies.

Canadian Federation of Independent Business — Monthly Business Barometer

October 2026 results, published 22 October 2026 · 301 responses, 1–8 October · accurate to ±5.6%, 19 times in 20

The 50% insufficient-demand figure, the 43% skilled-labour shortage, the staffing intentions of 22% against 11%, and the finding that businesses expect to pass on about 21% of higher fuel costs.

cfib-fcei.ca/en/research-economic-analysis/business-barometer

Ontario Nonprofit Network — 2026 State of the Sector survey

Ontario’s nonprofits: Focused on preparedness during uncertainty, published 15 October 2026 · 741 organizations · research by Environics

The 77% reporting increased demand, 84% reporting increased expenses against 44% reporting revenue increases, 53% reporting recruitment and retention difficulty, and 31% without access to a reserve fund.

theonn.ca/topics/advocacy/nonprofit-sector-surveys/2026-survey-results

Verizon — 2026 Data Breach Investigations Report

2026 edition

The finding that the most frequent causes of a breach continue to involve the human element — social engineering, phishing and stolen credentials — alongside the exploitation of software vulnerabilities. We have quoted the report qualitatively rather than attaching percentages to it.

verizon.com/business/resources/T343/reports/2026-dbir-data-breach-investigations-report.pdf
What this piece is, and what it is not

The Top 20 is an editorial prioritization, not a survey result. No study asked organizations to rank these exact twenty needs against one another. The priority ratings are our qualitative judgement, informed by the sources above and by our own client work. Reasonable practitioners would order them differently.

The nonprofit data is Ontario-specific. ONN surveys Ontario organizations, so those four figures describe this province rather than the country. We have said so wherever they appear rather than generalizing them.

The CFIB figures are national and have a stated margin of error. A reading of 50% carries a confidence interval of roughly five and a half points either side.

Our methodology and limitations statement sets out how we reach positions like this one, and where our judgement stops and evidence begins.

Sources checked 28 October 2026 Each link was opened and each figure read off the original on that date.